Define editable in terms you can test
A screenshot of a chart is editable as an image, but its categories and values are not editable as chart data. If the finance team expects to change a month or update a number, require a chart object with the underlying series and workbook. State whether links to external Excel files are allowed.
For the Alder close, the requirement is embedded and unlinked. That makes the deck portable as a single deliverable: the reviewer does not have to find a workbook on the agent’s Windows drive. It also means the agent must update the embedded data and the chart’s saved values consistently.
File-generation libraries can create editable chart objects too. Native Office execution is useful when the task is to continue an existing deck and inspect its actual PowerPoint rendering. Do not confuse an editability requirement with a claim that only one tool can produce it.
Continue the presentation’s structure
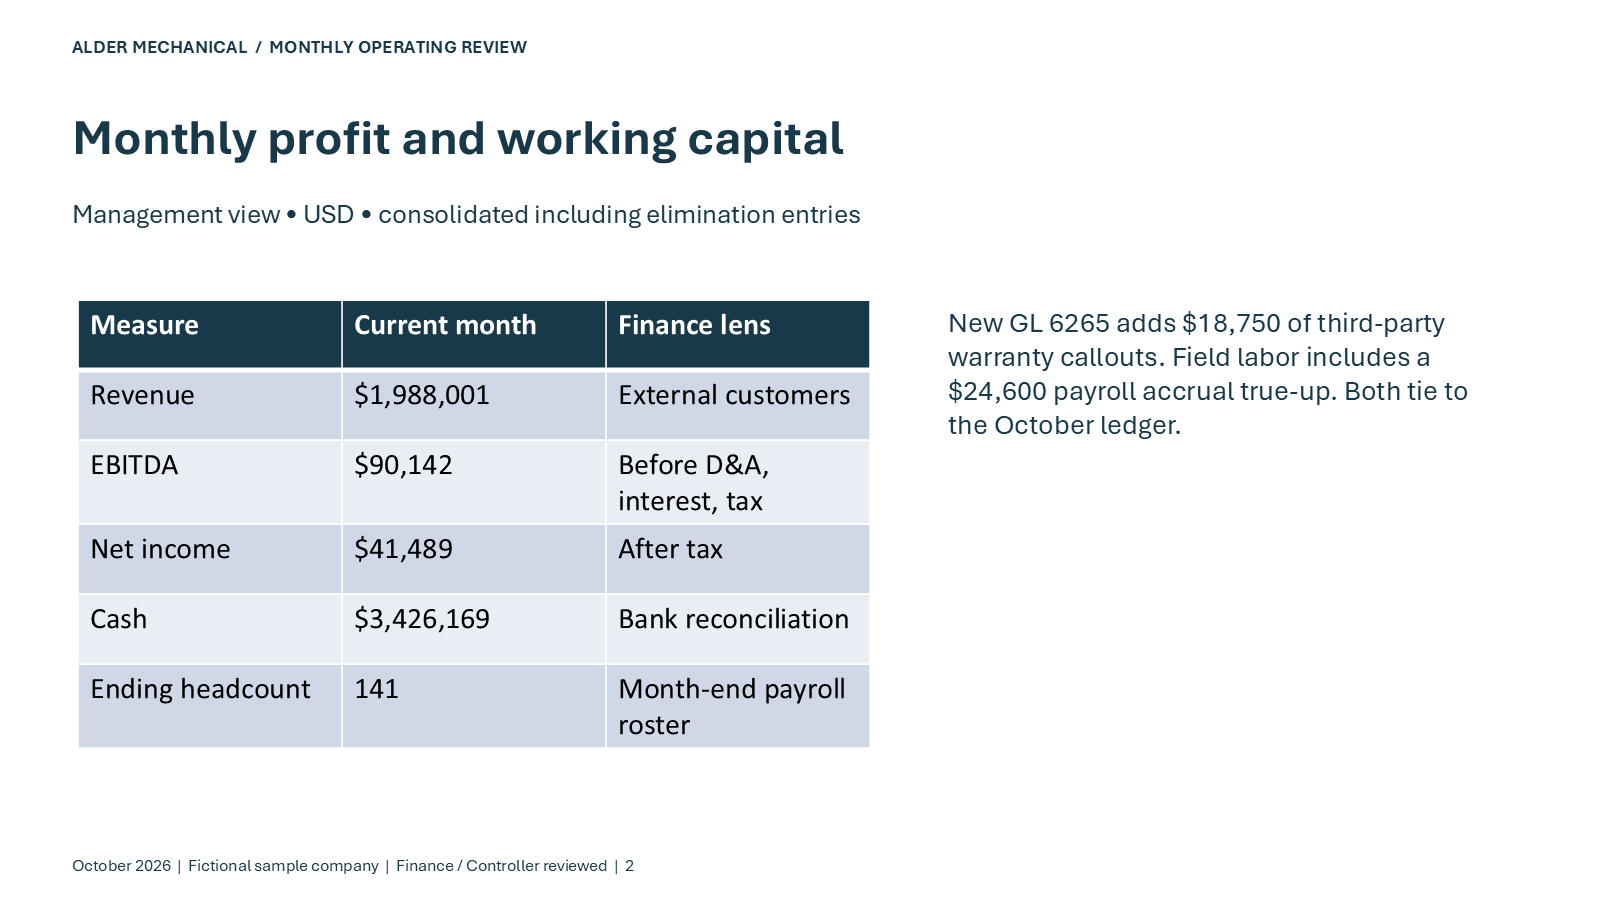
The task begins with September’s six-slide management deck. October should preserve the deck’s reporting structure and update the date labels, financial table, native charts and commentary. Starting over with a new template would make the monthly review harder to compare.
The source workflow’s deck stage opens the existing presentation through PowerPoint COM. The recorded output retains three chart objects, each with embedded data. The independent validator checks the resulting PPTX rather than trusting the script’s success message.
Before an agent changes a live deck, make a copy. Inventory slides, chart objects, tables and external relationships. After editing, compare that inventory with the intended changes. A missing appendix or a chart replaced by an image should appear as a structural difference, even if the first slide looks excellent.
Inspect the package without modifying it
A PPTX is an Open XML package. The small inspection below lists chart parts, embedded files and relationships marked as external. It is deliberately read-only. It does not prove that a chart is correct or that an external relationship is unsafe; it identifies what to inspect next.
For each chart, compare its categories and series values to the independently verified report. If there is an embedded workbook, compare that data too. Then open the deck in PowerPoint and confirm that Edit Data works and the visible chart agrees.
from zipfile import ZipFile
from xml.etree import ElementTree as ET

with ZipFile("October 2026 review.pptx") as deck:
    print("Charts:", [n for n in deck.namelist()
                      if n.startswith("ppt/charts/chart") and n.endswith(".xml")])
    print("Embedded files:", [n for n in deck.namelist()
                              if n.startswith("ppt/embeddings/")])
    for name in deck.namelist():
        if name.endswith(".rels"):
            for rel in ET.fromstring(deck.read(name)):
                if rel.get("TargetMode") == "External":
                    print("External:", name, rel.get("Target"))
Review the rendered deck after validating its numbers
A numerical check can pass while a text box clips the conclusion or a legend hides a series. Export every slide and inspect titles, units, legends, date labels, chart categories, axes and wrapping. Compare the visible totals to the report rather than to the agent’s narrative.
Our sample provides all six exported slides. Download the PPTX and compare it with the screenshots on the workflow page. The artifacts let you distinguish a formatting claim from a data claim.
Keep the output path and evidence in the handoff. A finance reviewer should receive the editable file, a preview for quick review, and a short statement of which data changed. A flattened PDF can accompany the deck, but should not silently replace the requested editable PPTX.
Use the desktop where the workflow needs it
An agent can remain in your existing application or Linux runtime while using Panes for the Office steps. Send the input file to the Windows computer, run the desktop automation, inspect the screen and bring the output back. The MCP and SDK docs describe that connection.
Separate work ownership from visibility: give the agent its own working copy and let a reviewer watch or take over through the viewer. Avoid simultaneous human and agent edits to the same open deck. Save a checkpoint before the presentation stage so that retrying a failed export does not rerun a financial roll-forward.