Inspect the two representations of chart data
The October management deck contains three editable charts with embedded workbooks. The chart parts also store values and categories used by the saved presentation. An edit that reaches one representation does not establish that the other agrees. The complete deliverable needs both data consistency and correct rendering.
In this deck, the chart values and categories use literal XML collections, while the series titles reference cells in the embedded Sheet1. That is an observed property of these files, not a rule for every PPTX. A generic reader must also handle other chart representations or report that it cannot check them.
Our test follows the chart’s embedded-data relationship to the corresponding XLSX, reads its saved cells, and compares the known monthly table layout. It does not guess which embedded workbook belongs to which chart based on a filename. If the expected representation is missing, the check stops rather than treating the chart as verified.
Establish the native deck’s baseline
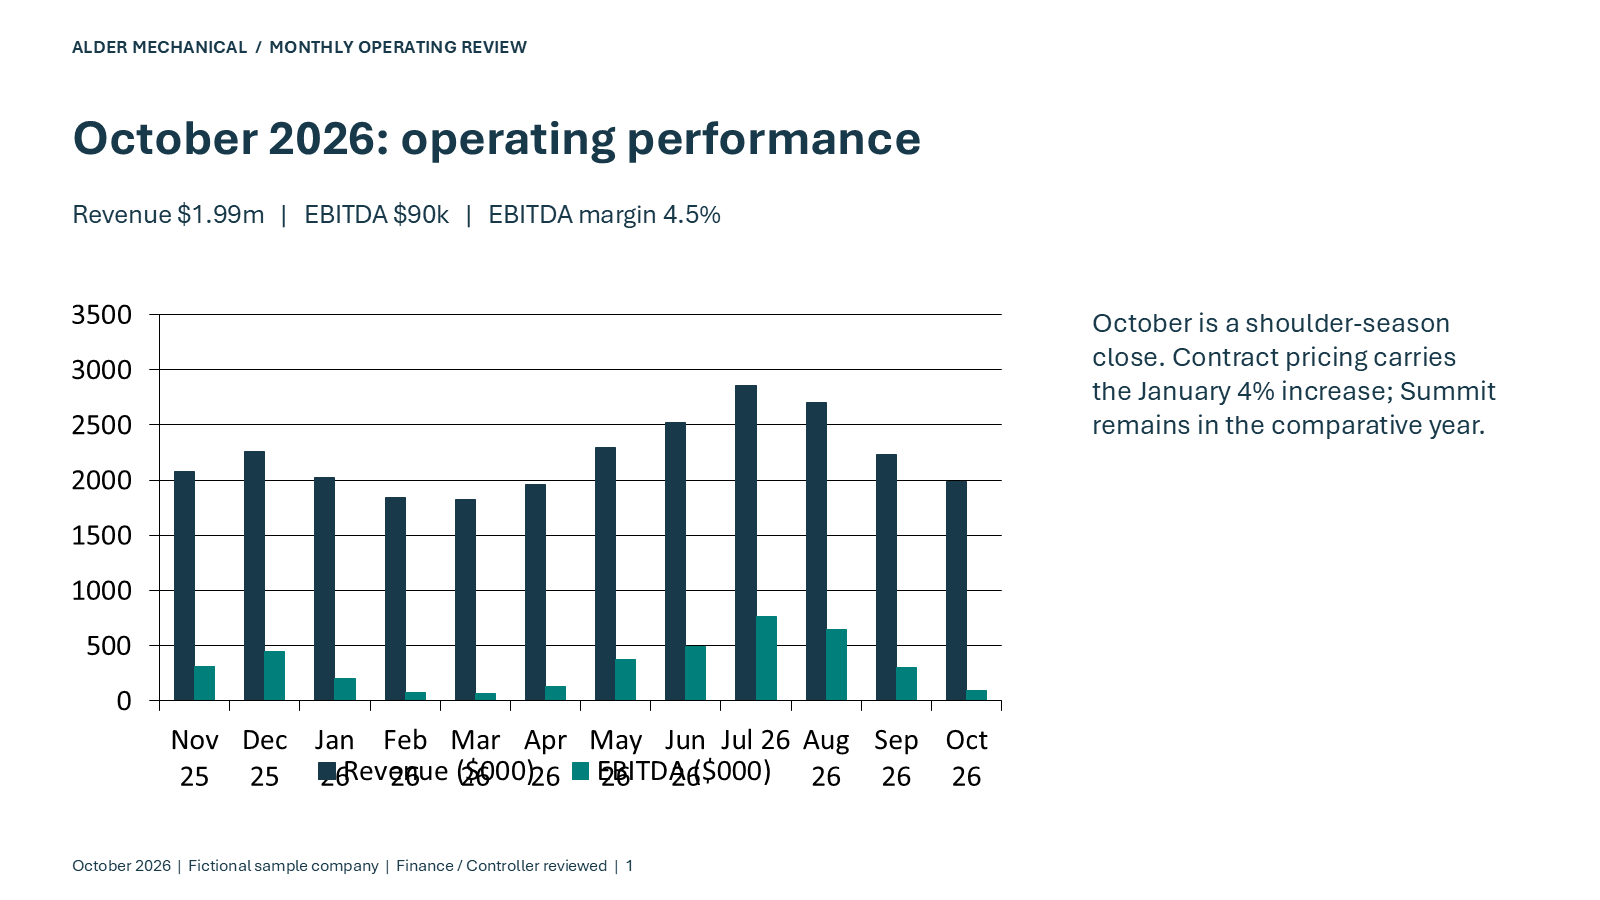
The first slide’s chart contains revenue and EBITDA for twelve months. The EBITDA-margin and closing-cash charts each contain one twelve-month series. Across those three charts, the check compares 36 category labels, four series names and 48 numeric points: 88 items in total.
The original passes all 88 comparisons. October revenue is 1988.00106 in the chart’s $000 units, corresponding to $1,988,001.06 in the close model. Keeping that unit relationship explicit prevents a thousand-fold reporting error from being hidden by a superficially reasonable number.
The native workflow also has an independent source-based reconciliation. Agreement between a chart and its embedded workbook is necessary but not sufficient: both could contain the same wrong value. Keep the source-ledger comparison as a separate check.
Change only one side and make the checker fail
The first fault adds 1.0 to October revenue in the chart’s saved numeric collection, leaving the embedded workbook unchanged. The check reports chart value 1989.00106 versus embedded value 1988.00106 at series zero, point eleven. In this chart’s units, that difference represents $1,000.
The second fault adds 1.0 to cell B13 in the embedded chart workbook and leaves the chart collection unchanged. The mismatch reverses: the chart still has 1988.00106 and the embedded workbook has 1989.00106. Each fault produces exactly one reported mismatch.
We do not claim how either deliberately modified package would render after PowerPoint opened and possibly updated it. The experiment establishes that the saved package contains inconsistent representations before that native follow-up. It makes the verifier’s coverage observable instead of assuming a passing checker would catch a real error.
| Case | Result | Mismatch |
|---|---|---|
| Original native deck | PASS | None |
| Only chart value changed | FAIL | Chart 1989.00106; embedded 1988.00106 |
| Only embedded value changed | FAIL | Chart 1988.00106; embedded 1989.00106 |
Update through the app, then inspect what was saved
The recorded deck-update stage works in the real PowerPoint object model and saves the October presentation. Microsoft documents that ChartData.Workbook exposes the workbook associated with a chart and requires ChartData.Activate before access.
For an agent workflow, define the data update, saved-package check and slide review as separate stages. After saving, download the exact file and run the package check. Export and inspect all slides for titles, units, dates, legends and wrapping. A numerical package pass does not prove that a label is visible.
If a check fails, return the chart, series, point, observed value and expected value. Do not silently replace a whole chart with an image just to make the deck look right. If an image is the desired output, agree that deliverable explicitly; otherwise preserve the native chart the team expects to edit.
Use the example as a test contract, not a universal validator
Download the checker, full results and original deck. The script reruns the baseline and both deliberate faults without writing over the input.
This reader is deliberately scoped to the example’s literal category/value collections and adjacent embedded-sheet columns. It does not certify arbitrary chart types, linked workbooks, formulas or unsupported representations. Adapt the contract to your own deck and include a known-bad case for every claim you want the verifier to make.
For the wider workflow, see editable deck delivery and the monthly-close walkthrough. Use Panes for the native application steps and keep the evidence with the returned PPTX.
python -m pip install openpyxl==3.1.5
python chart_consistency.py "October 2026 review.pptx" --report chart-report.json